5.09 – 06/03/2025
This release sees significant changes to the Dashboard reporting area.
Streamlined reporting
You can now use Tabs to efficiently navigate from viewing a Month’s data to a Year or a Week and vice versa. The dashboard can be run on Electricity, Gas or Water.
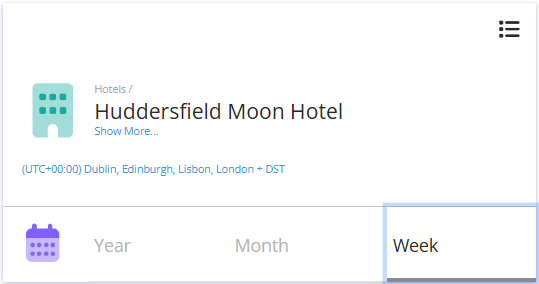
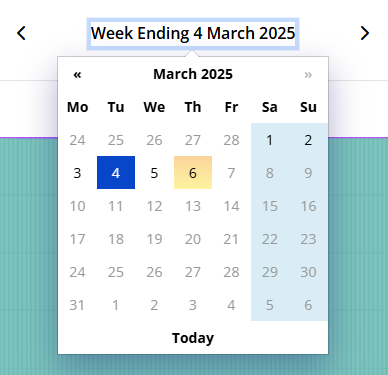
You can change the reporting period of the Dashboard by selecting the date label above the graph or using the arrows on either side.
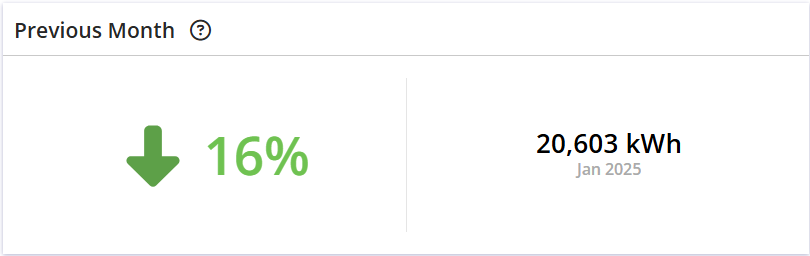
Your energy performance
Performance indicators make it easy to understand your energy increases or decreases against similar periods in the last few weeks or the last year.
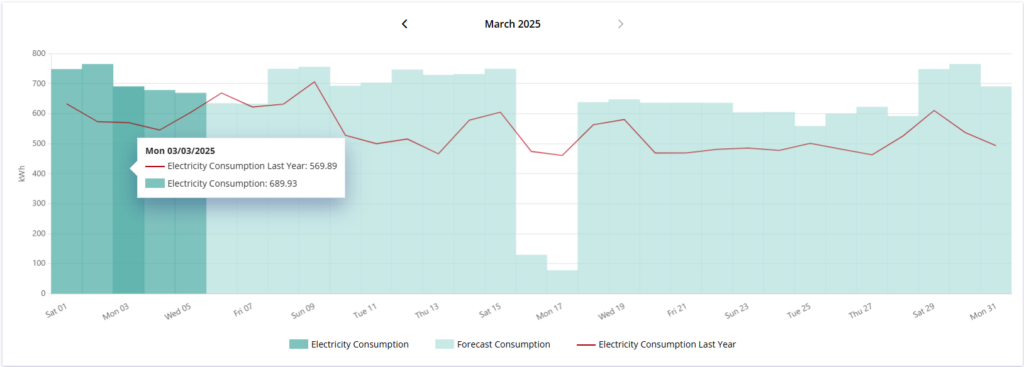
Forecasting your current month
For Year and Month reports including the current month, you’ll find forecasted data that allows you to review performance before the month-end. This forecasted data is calculated by using recent data from the same data source.
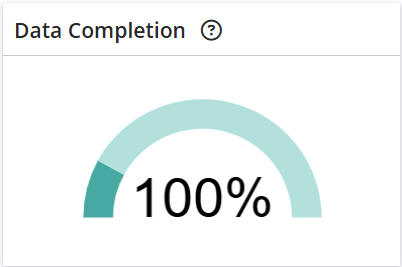
Data Completion
The Data Completion tile will show you if there is any missing data during your reporting period. You’ll also be able to view how much of your data is estimated, actual, forecasted or historic.
We hope this will empower you to understand your data in more detail.
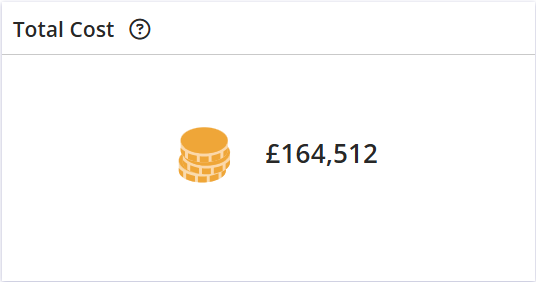
Cost
The Cost tile gives you an indication of the costs associated with your energy consumption using a basic pence per kWh value. This will use an average value as a default and can be edited in Settings.
4.52 – 22/06/2022
Compare your Timeline against the Previous Year
We’ve added new options to Add the Previous Year line to your consumption report when selecting any interval option in Timeline.
Baseload reporting in Timeline
Your minimum unoccupied Baseload is now highlighted when running a consumption report with an Occupancy overlay in Timeline. New KPIs appear that show the potential savings from matching this baseload during all unoccupied intervals.
New League Table navigation for even easier analysis
You can now open a Timeline report directly from the League Table by clicking the graph icon. This opens the report in a new tab and the relevant metrics will be overlayed.
Various enhancements
- Full refresh of New Tab Dynamic reports
- Improved efficiency of Gallery and Dashboard page functionality
- Laid groundwork for upcoming features
4.46 – 26/01/2022
Time for a reporting upgrade!
We’ve sprinkled more magic throughout your Dynamic reports to help you save time, energy and carbon.
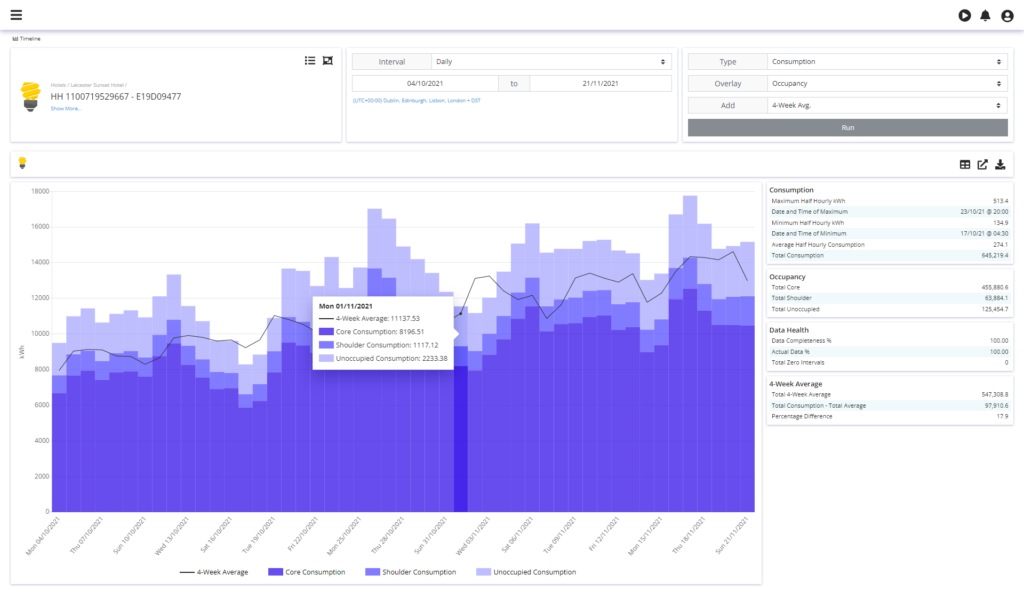
Gauge your performance
Compare your energy use against the last few weeks or the previous year with new reporting options in Calendar and Timeline.
We’ve added new options to Add a 4-Week Average line to your consumption report when selecting a daily or weekly interval option in Timeline.
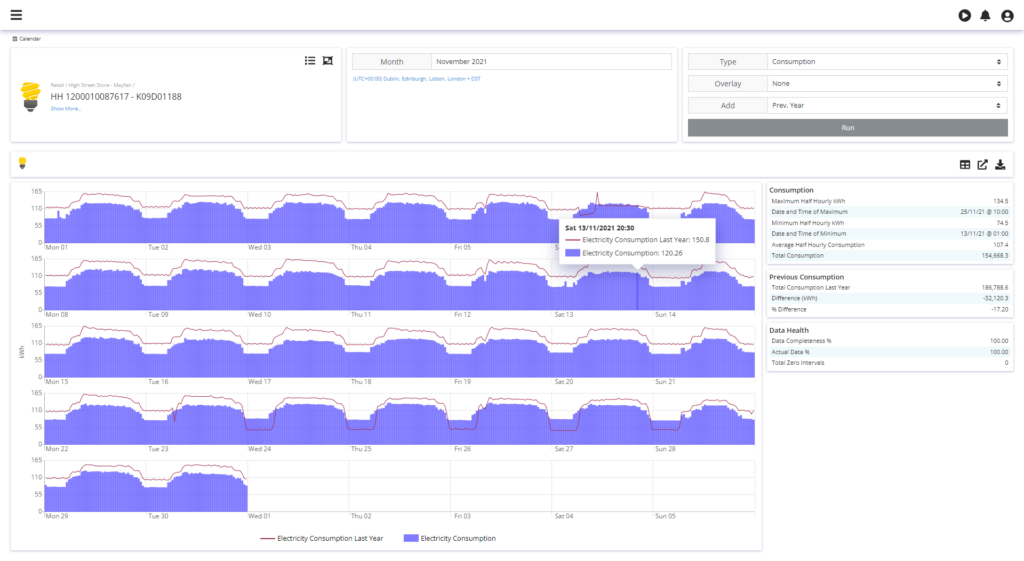
There is also a new option to Add a Previous Year line to your consumption report in Calendar.
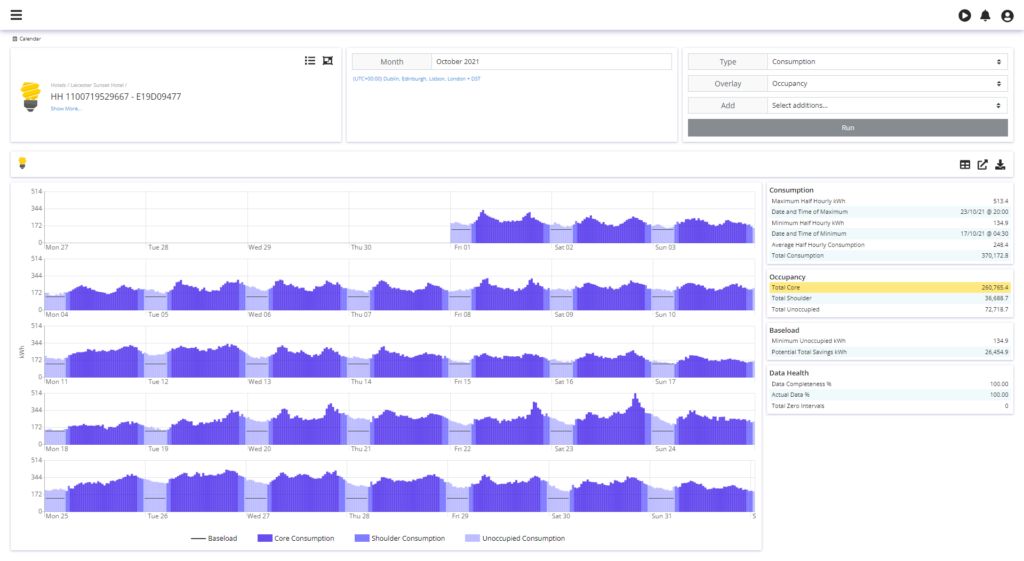
Baseload reporting in Calendar
Your minimum unoccupied Baseload is now highlighted when running a consumption report with an Occupancy overlay in Calendar. New KPIs appear that show the potential savings from matching this baseload during all unoccupied intervals.
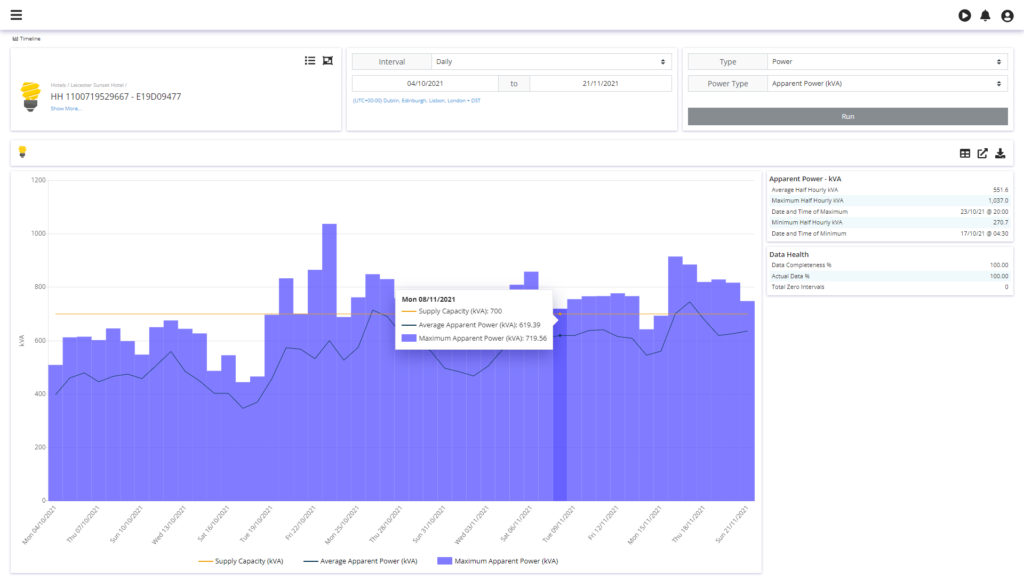
Compare your Maximum and Average Power
When you run any Power > Active Power (kW) or Power > Apparent Power (kVA) report, for a daily, weekly or monthly interval in Timeline, you will see both your Maximum and Average Power during that period.
Enhancements to Settings
- Re-designed so Occupancy and Parameters are on a single page with tabbed navigation
- Improved efficiency of functionality
Various enhancements
- Condensed KPI tiles so that they take up less space and more information can be seen at once
- Switched the Daylight overlay colours so that Daylight and Night more closely represent their datasets
- Laid groundwork for upcoming features
- Various additional improvements and bug fixes
4.43 – 24/11/2021
New additions to Dynamic Reporting
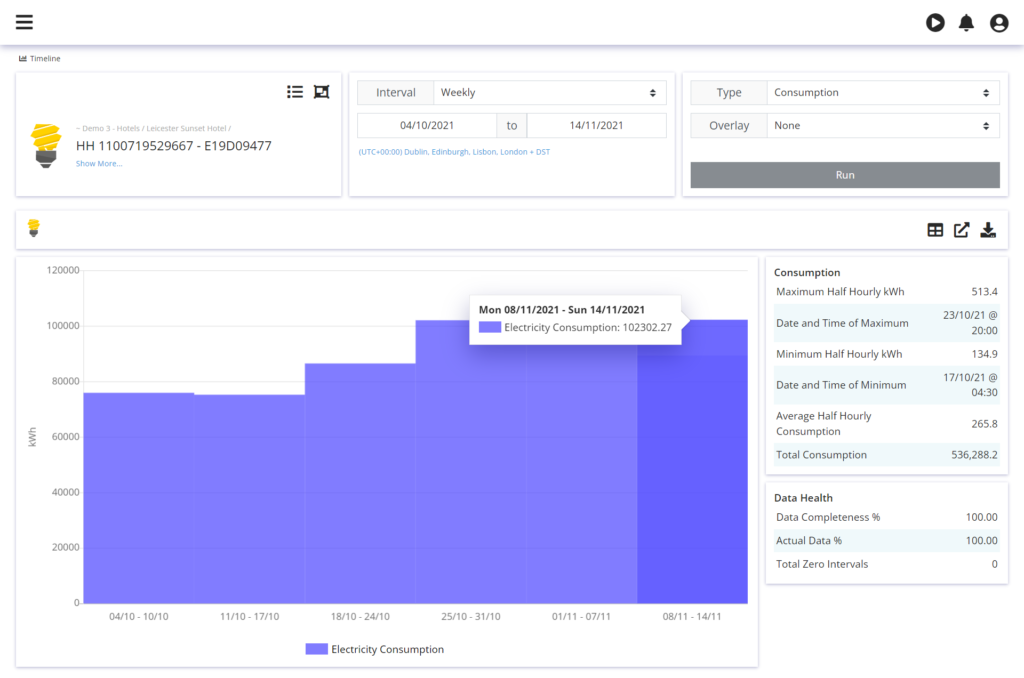
We have added a new interval option to all Timeline reports. Users can now report by week (Mon-Sun).
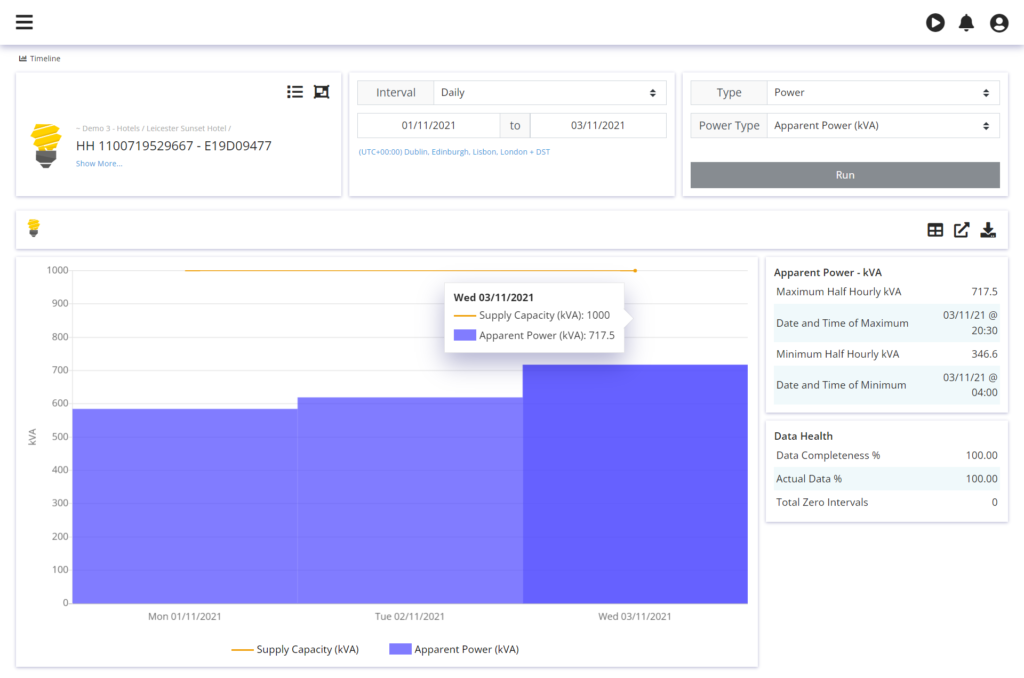
New Timeline and Calendar report options
Available Supply Capacity line is displayed when running a Power > Apparent Power (kVA) report.
Various enhancements
- Support ended for Internet Explorer 11 to allow for more advanced browser functions
- Improved efficiency of Parameters page functionality
4.29 – 21/01/2021
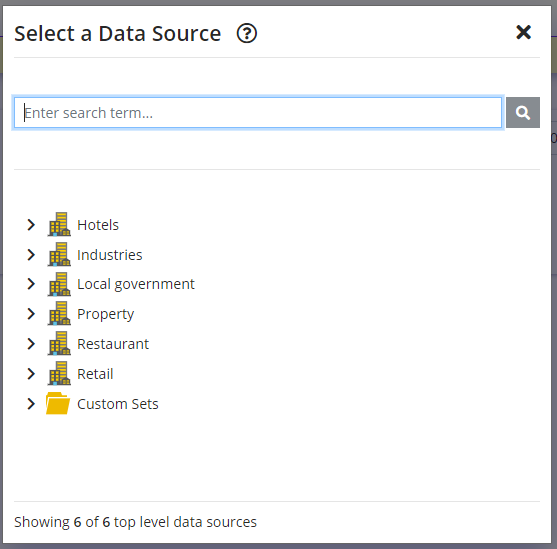
Improved Data Source Selection and Search User Interface
We have integrated the search functionality within the tree. To access Search, simply open the tree. This is to make it easier for users to find and select sites or meters.
Various Security Improvements
We have made various improvements to the security of the reporting platform.
4.25 – 21/10/2020
Improved Registration Process
We have consolidated the registration process into a single step removing the requirement for email verification separate to account setup.
Gallery Refinements
We have streamlined the Gallery reporting request process to more clearly show report statuses and refresh these statuses more accurately.
Various Security Improvements We have made various improvements to the security of the reporting platform.
4.22 – 19/08/2020
Enhanced Comparison reports
We have increased the information available in all Comparison reports to include the date ranges of each previous period and Data Health figures. This information is also shown when hovering on the graph.
We have also amended the current period to be displayed more prominently.
League Tables now include Data Health
We have added Data Health information to our League Table reports to allow you to assess the data shown in more detail.
‘Show more’ added to Data Source tile
We have added a Show More option to cater for Data Source names that do not fit within the tile.
New Static Report Option
You can now run Static reports to a New Tab.
4.18 – 28/05/2020
New Timeline and Calendar report options
We have added reporting functionality to Timeline and Calendar areas. You can now select Type > Data Health. This report shows consumption data, overlaid with the status of the data and a line graph showing % completeness. You can also hover over graph to see Data Completeness.
Data Health tile for all Timeline and Calendar reports
All Timeline and Calendar reports now have an additional KPI tile that shows your Data Health.
Site name available in League Tables
All League Tables include Tree Location in a dropdown for each row.
Custom Set Interface improvements
Save and Close buttons have been added to the bottom of the ‘Create New Custom Set’ menu. This improves the user journey.
We have also removed the ‘Remove All’ button in favour of the ‘Close’ button.
New icons – Company, Site and Custom Sets
We have replaced the Company, Site and Custom Sets icons in the tree, to increase clarity and improve differentiation.
4.17 – 22/04/2020
We have added a new tile to the Dashboard to demonstrate the emissions from your electricity or gas consumption. You will now see the kgCO2e. This is calculated using the UK Government Emissions Conversion Factor and will not take into account factors such as onsite generation or a green energy tariff.
We have also added an additional tile for Water. You will see the equivalent number of Dishwasher Cycles alongside your pre-existing equivalent tile.
League Table – Sticky rows or columns
Once a League Table report is run, if you scroll vertically the first row (or headers) should remain at the edge of the scrollable area, if you scroll horizontally as the name column is about to scroll out of view it should stick to the edge of the scrollable area.
League Table – New groupings
League Tables are now grouped into Types and Subtypes
- Energy
- Total Consumption
- Occupancy
- Average Consumption
- Total Consumption
- % Share
- Unoccupied
- Normalisation
- Floor Area
- Population
New tab
You can now open your Dynamic reports in a new tab allowing you to compare multiple reports at the same time. Simply run the report and click on the below icon located next to Table view and Download.

4.15, 4.16 – 25/03/2020
Dashboard Updates
We have added a new tile to the Dashboard to help you understand your energy figures. For electricity, you will see the equivalent number of times a Kettle is Boiled, for gas you will see the equivalent Number of Homes Heated and for Water, you will see Pints of Milk.
We have also added a Key to the Last 7 days graph so you can toggle on and off the average and consumption lines.
Quicker access to csv Downloads in Dynamic
You can now ‘Download as csv’ directly from the Dynamic report page.
Further changes to League Tables
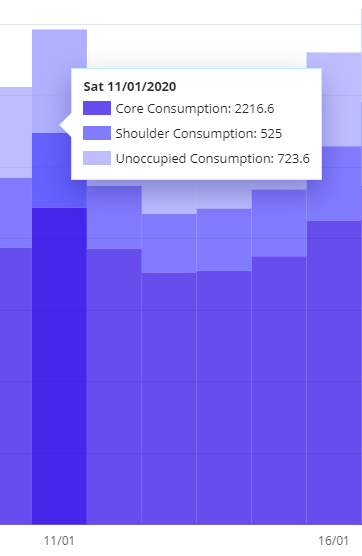
We have added new KPIs to the Occupancy League Table to help you compare Core, Shoulder and Unoccupied consumption.
You can now view the relevant Parameter figures in Population and Floor Area League Tables.
Various enhancements
- Resolving an issue where the Full Date (including month and year) was not displaying in Table view in Dynamic reports.
- Added the ability to reset the time until a report in Gallery is deleted.
- Improved the clarity of the names of KPIs in Timeline and Calendar reports
4.14 – 23/01/2020
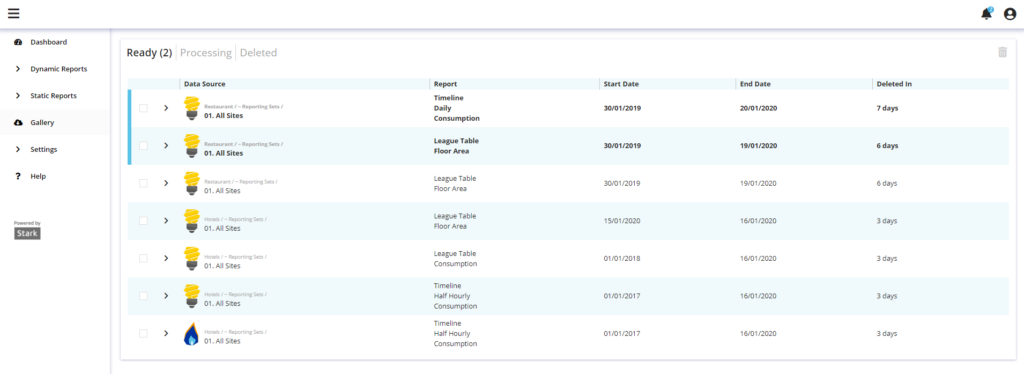
Gallery
You no longer have to sit and wait for a long Dynamic report to run. If your report does not complete after a short period, it will be sent to our report engines. You can track its progress in your notifications or in the Gallery under Processing. Once your report is complete, you can access it in the Gallery – Ready area.
Streamlining the Static report process
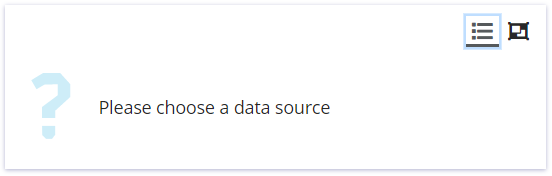
We have started to streamline the process of running a Static report. To choose a report, you can now use the button below or click on the Select a report… box.
You can now go directly from the Favourites area to your Report Library in a single click.
Further improvements will follow.
Day of the week in Timeline hover
The day of the week now appears in relevant Timeline hover views.
Various enhancements
- Reporting and Custom Set folders no longer
greyed out - Use of thousand separators in League Table reports
- Sort icon now closer to header in League Tables
- League Table columns separated by lines
- No data message adopted for League Tables
Various bug fixes including:
- Timezone appears on png/pdf download of Dynamic
reports - Default Apply DST to yes when swapping from a
timezone without DST options - Reset password includes rules for password
requirements
4.12 – 24/10/2019
Better missing data handling in Dynamic reports
Missing values in your Dynamic reports are now consistently represented by a dash. This is both in the Table data and when the report is downloaded as a csv.
Readability enhancements
Consistent use of thousand separators in all KPI tiles in Dynamic reports.
Various improvements across League Tables and Tables
- The ‘General Analysis’ League Table has been
renamed ‘Consumption’ - ‘Show All’ option available on League Tables
- Clearer indication of the current page in League
Table and when viewing the table of chart data
Various bug fixes including:
- Prevented scrollbar arrows appearing for chart keys at certain resolutions
- FIREFOX: Scrollbar issues resolved at 110% zoom so tree displays correctly
- Multiple improvements to error messaging including when no data is available
4.11 – 26/09/2019
Registration Process
The registration process has been consolidated into a single platform. It is now more efficient to register as a new user.
Toggleable Dynamic Graphing
You can now toggle what is displayed in your Dynamic graphs, after you have run them by selecting the item you would like to remove/add from the graph legend.
Single Data Source League Tables
League Tables can be run on any single site or meter giving you quicker access to KPIs on an individual basis.
Report Run Speed
Improvements made to report run speeds
New Notification Types
Increased functionality to notify user regarding Product news and updates.
Additional notification types added in preparation for the Scheduled reports and Alarms that will be made available in future releases.
Minor UX improvements made to:
- Dynamic Report layouts
- Toggle selection for Add in Dynamic Timeline and Calendar reports
- Messaging when user selects a report period containing no data
- Table view headings now fixed in place
- Timer wheel displays when downloading a report
- Clearer definition of Comparison ‘Day’
Various bug fixes including:
- Screen shaking after report run at certain resolutions
- Tree not loading next set of items at certain resolutions
- kVA displaying a single value when there is no Lag or Lead data
- CO2 reports showing incorrect Difference from Average figure
- Inconsistent ordering of Occupancy bands across Graph Legend, Table and csv download.
More event logging
Better diagnostics tools regarding user report running activity.
Other enhancements
Major behind the scenes improvements to allow future functionality to be added regarding Scheduling reports.